02
For operators
One simple station for the machines they run.
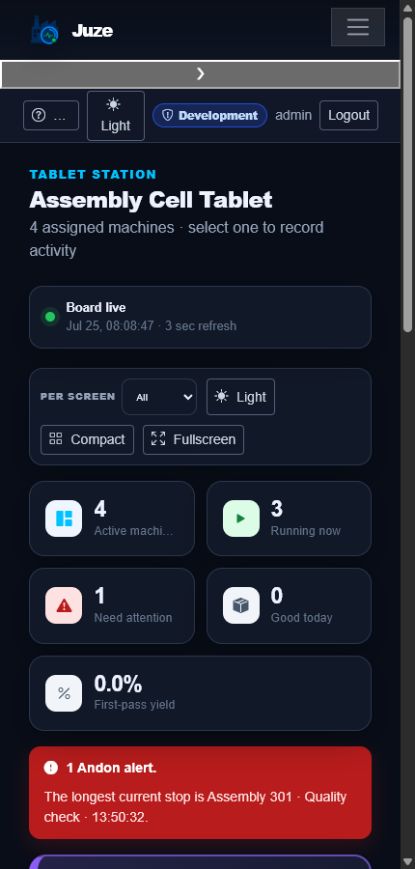
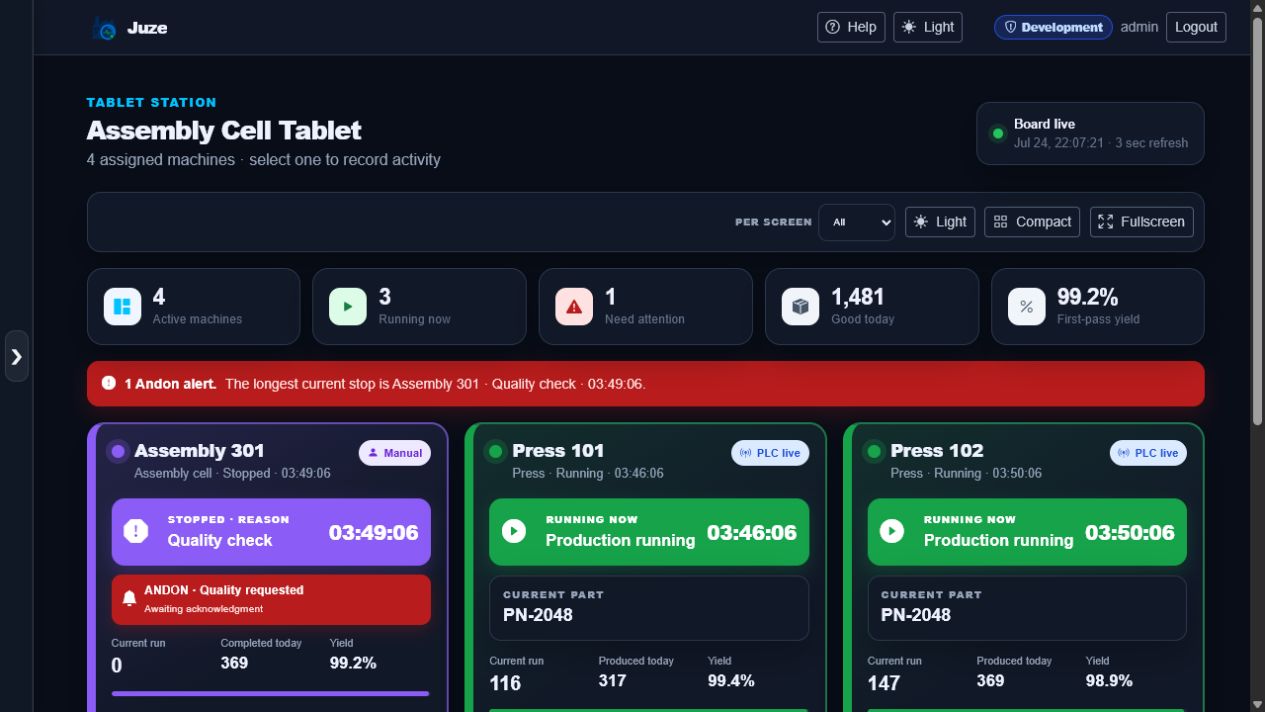
Assign only the relevant machines to each shared tablet. Operators see state and output, record activity, and raise an Andon without navigating the whole plant.
 Open full screen ↗
 JuzeTry it on your floor
Your machines are already telling you what is happening
One live screen shows what is running, what stopped, for how long, and why—across old manual machines and live PLCs. See the problem. Act sooner. Keep the history.
Material jam · 08:14 elapsed
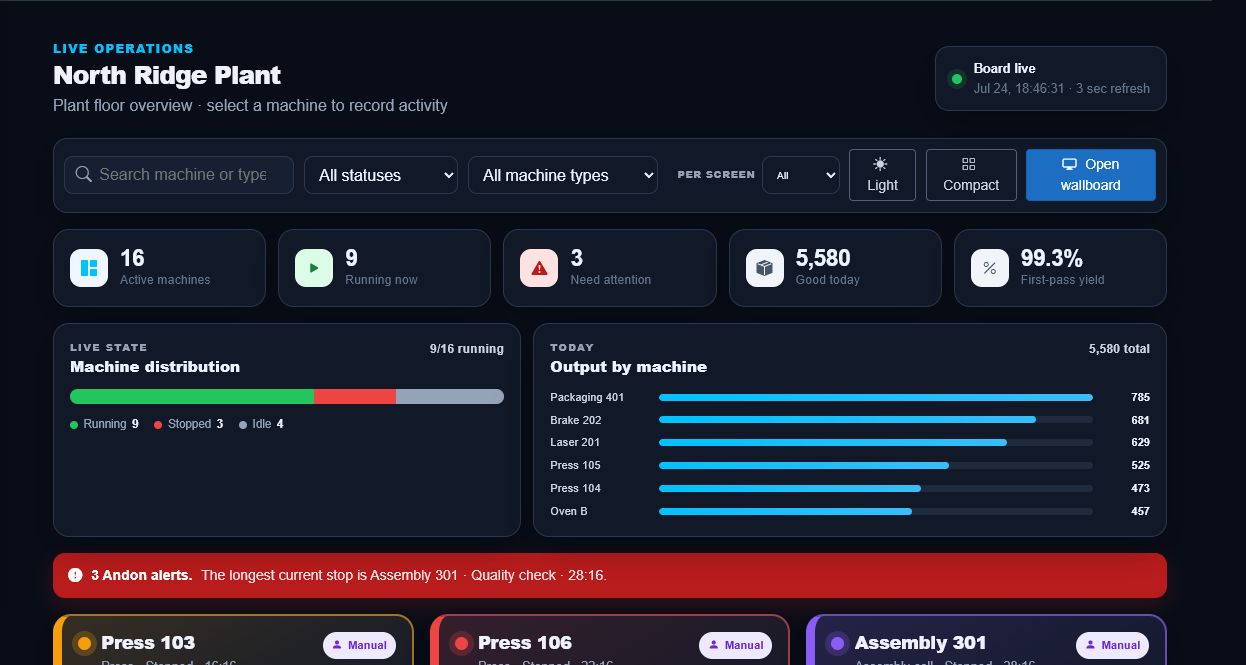
This is what “live” looks like
Start with the big question—what needs attention right now—then move straight into the machine, run, reason, and person behind it.
For supervisors and plant leaders
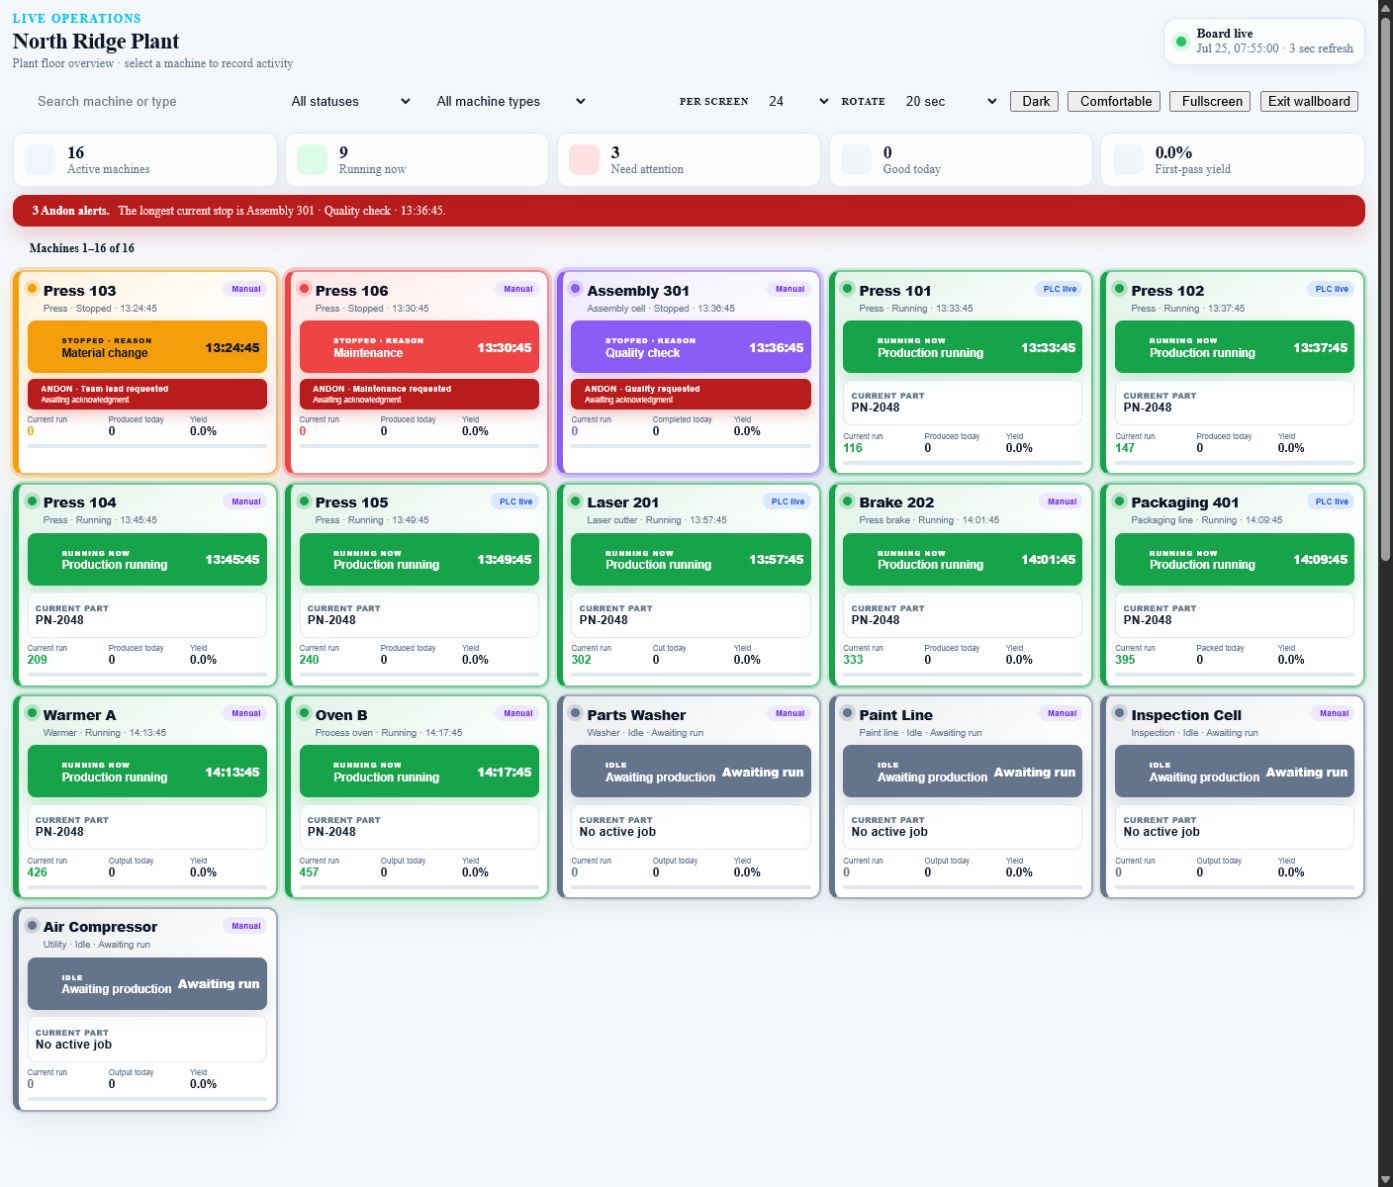
Running, stopped, idle, and attention states stay visible beside output, yield, and active Andons. Choose how many machine cards each wallboard shows, then rotate pages automatically for larger plants.
 Open full screen ↗
For operators
Assign only the relevant machines to each shared tablet. Operators see state and output, record activity, and raise an Andon without navigating the whole plant.
Open full screen ↗For reviews, meetings, and deeper analysis
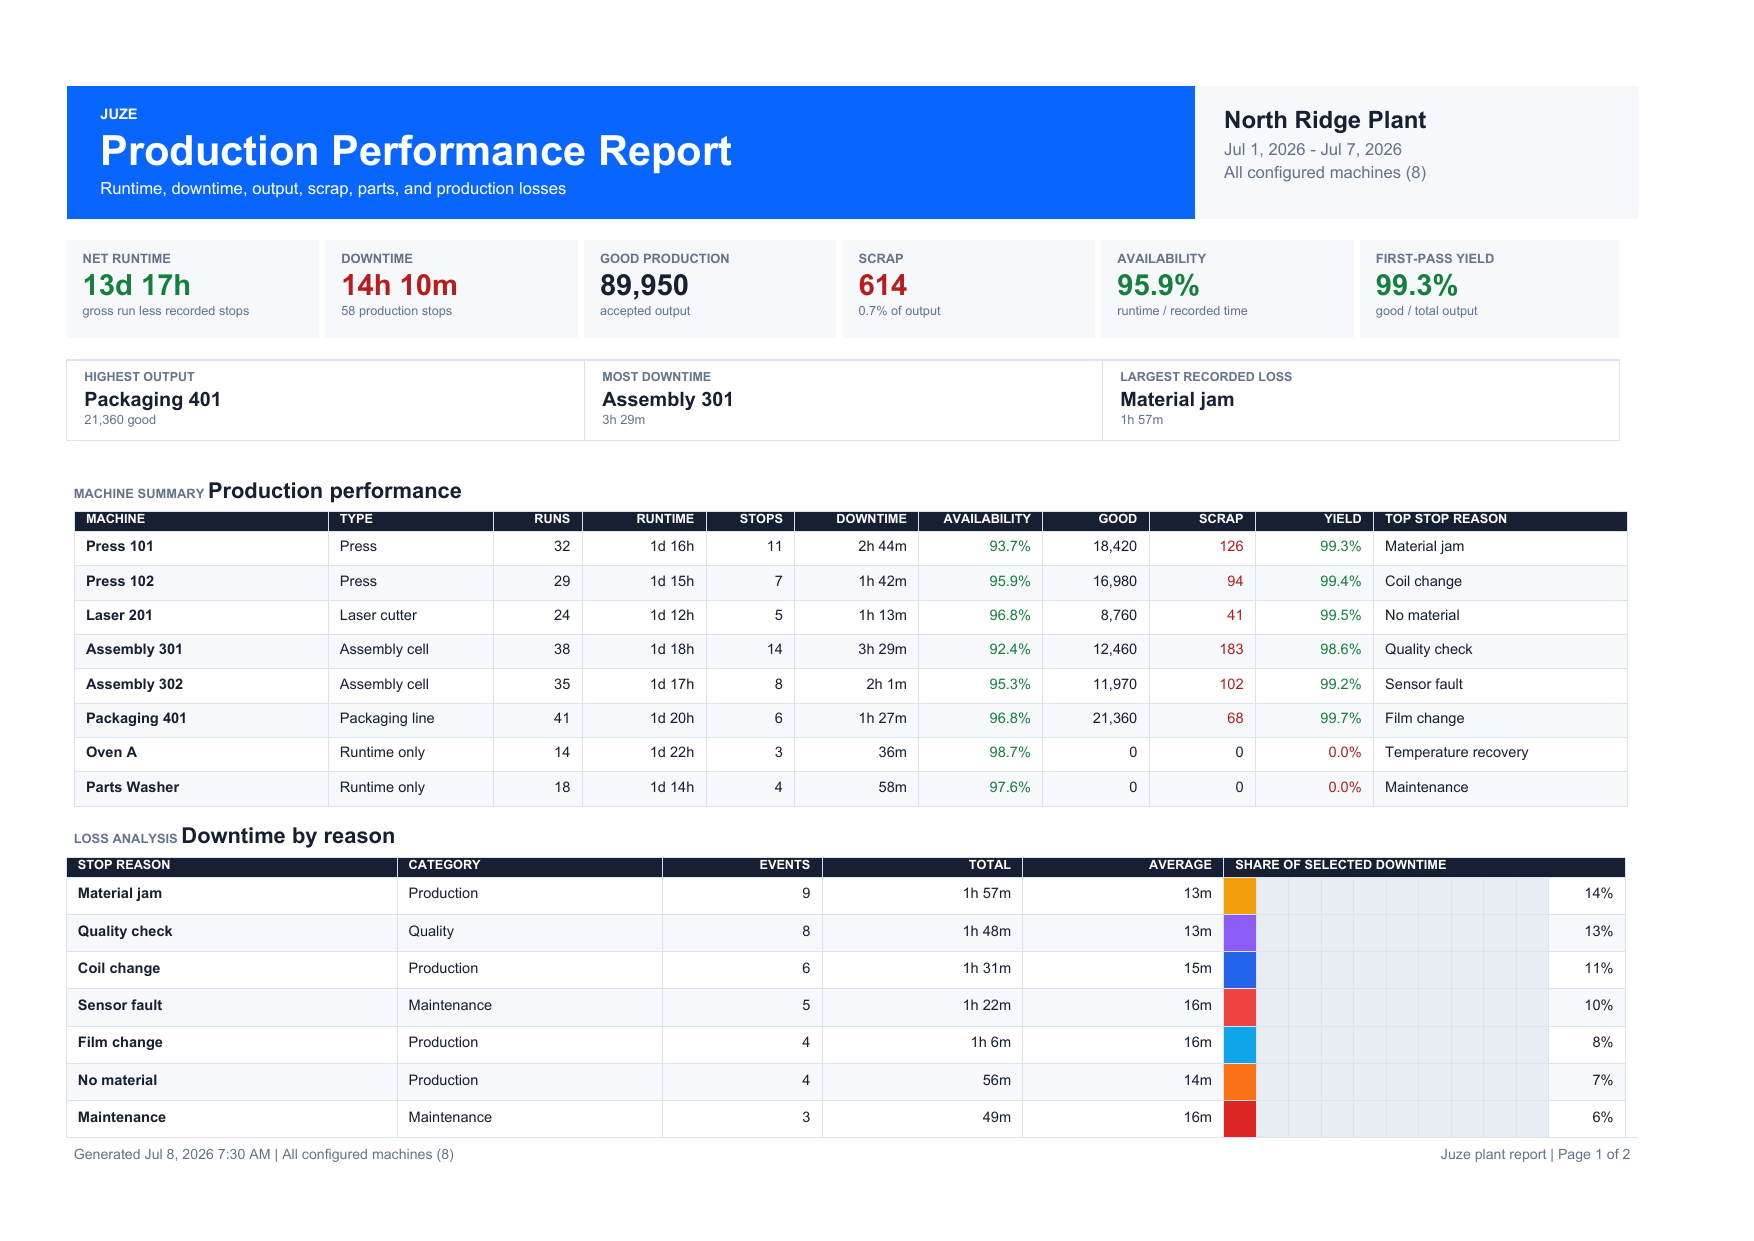
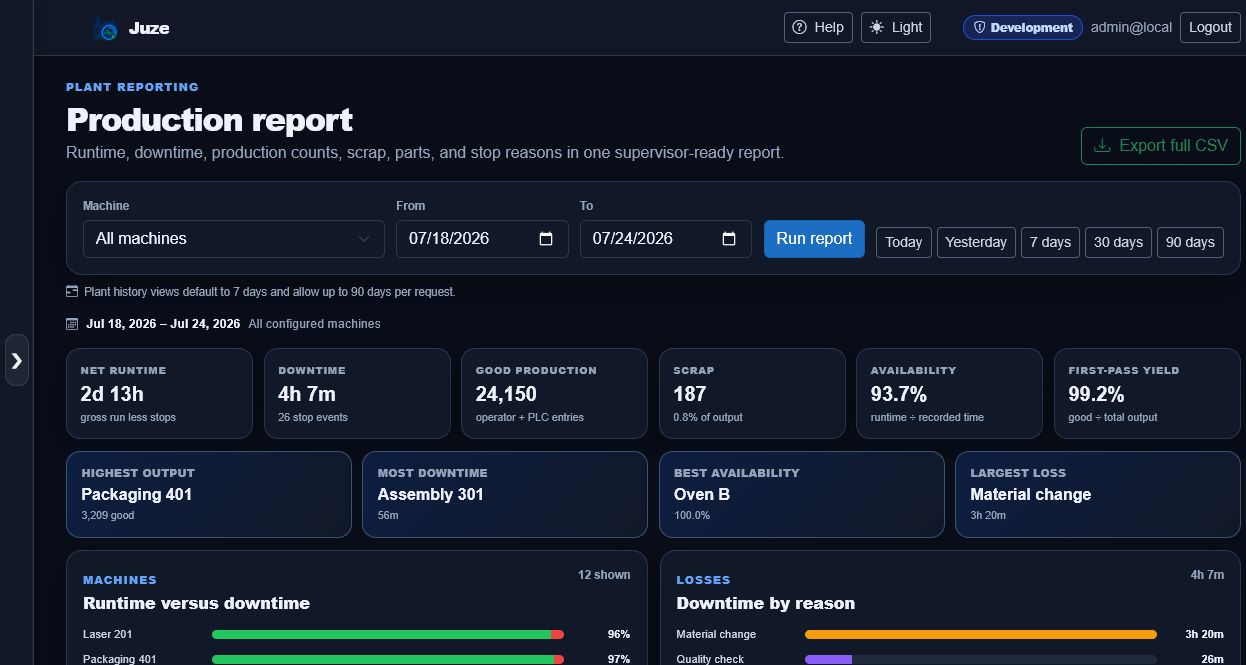
Run one filtered report, then download every row as CSV or a polished PDF for Production, Quality, or Maintenance. The date range, machine selection, and calculations stay consistent with the live screen.
 Open full screen ↗
What leaves Juze
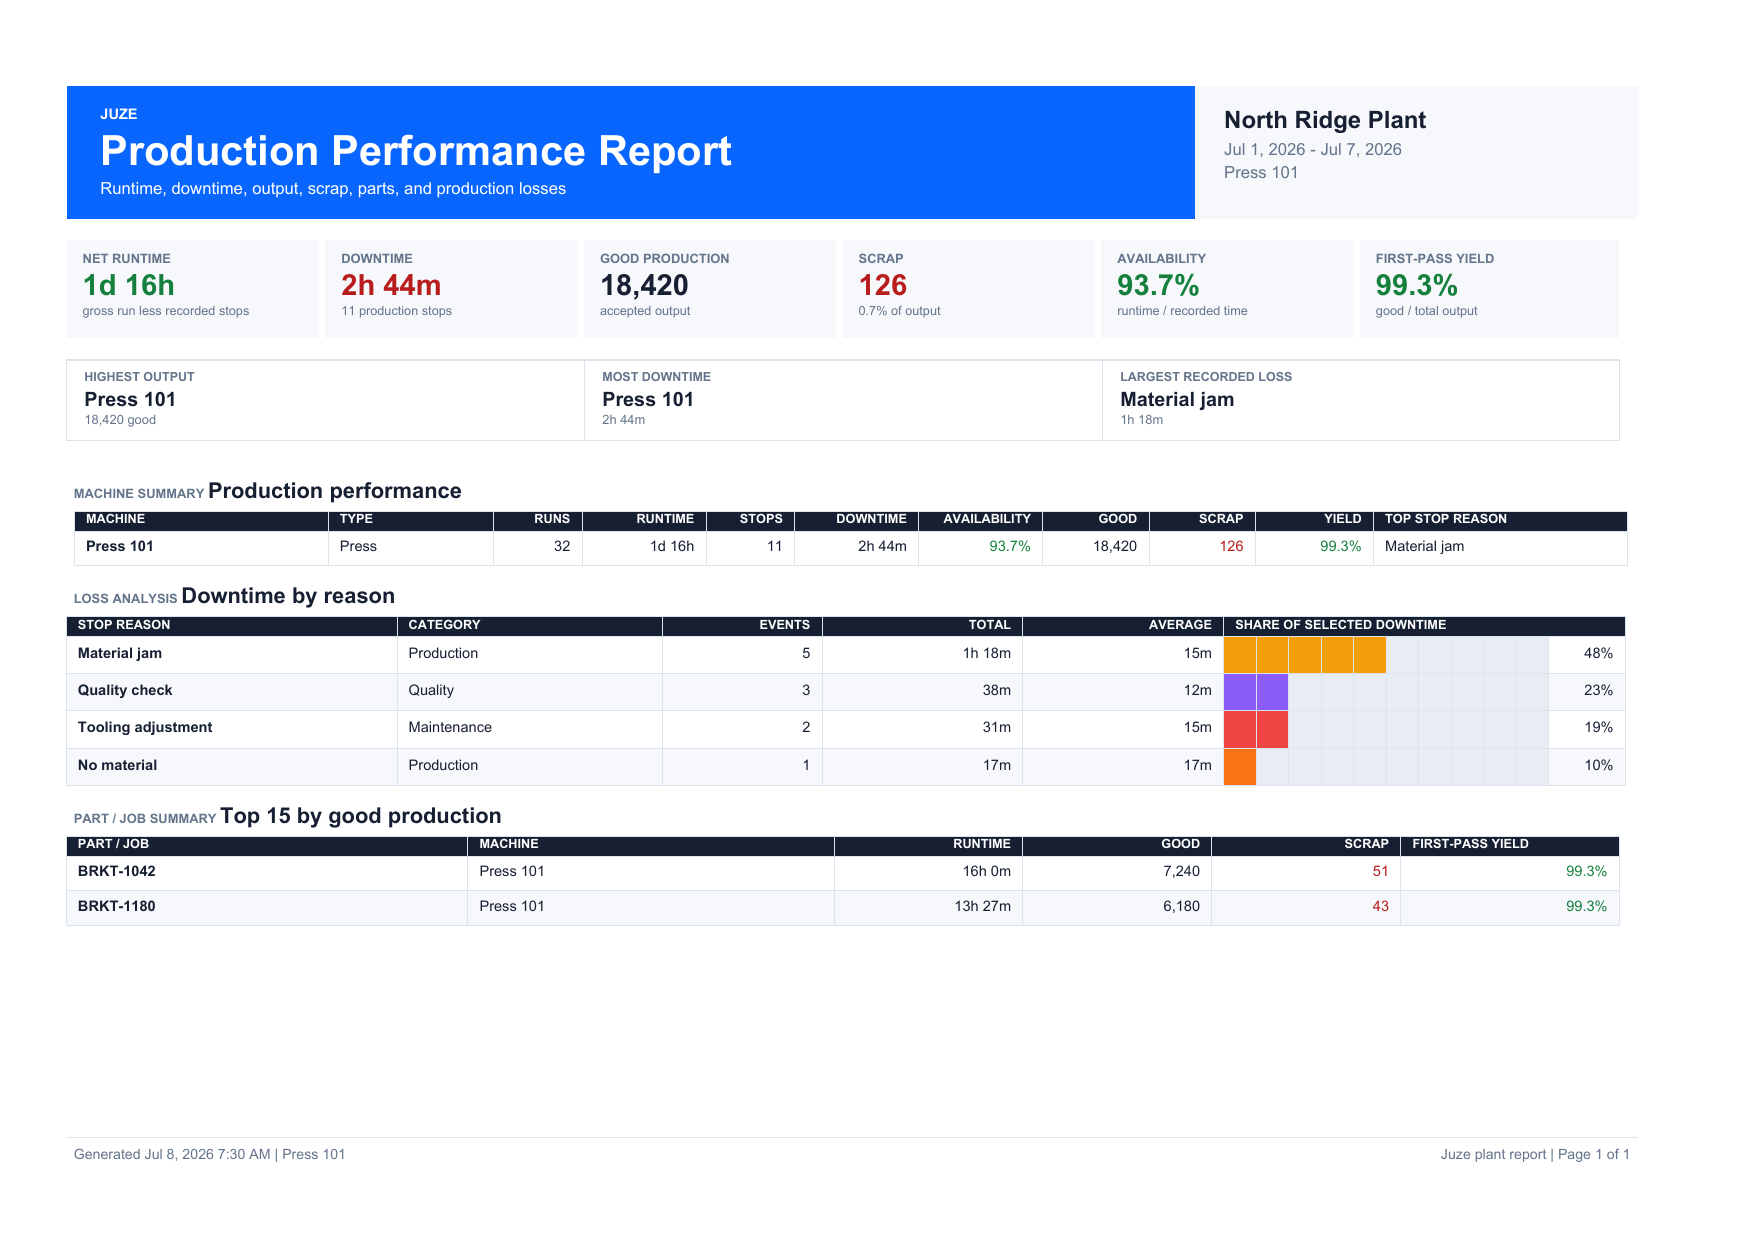
Choose all machines or one machine, set the reporting period, and export the same production picture as a meeting-ready PDF. Open either sample to see the actual document layout.
 Open full screen ↗
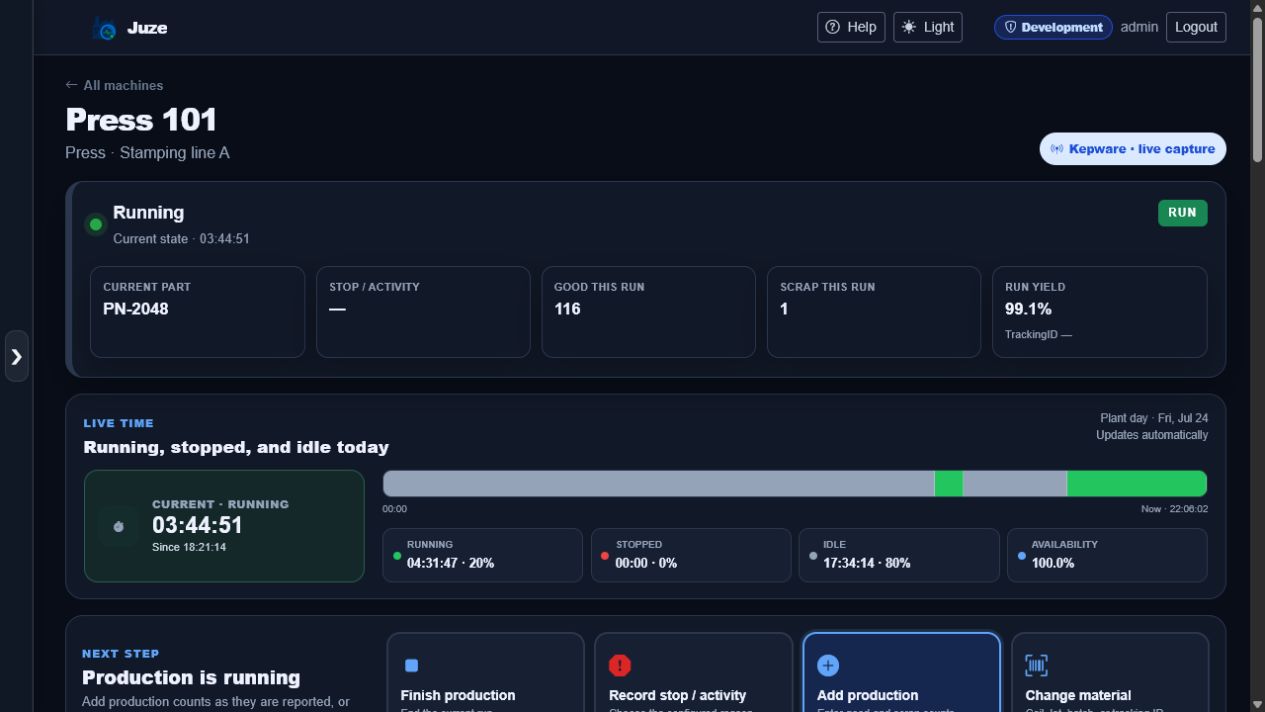
For the person solving the problem
See the current part, elapsed state time, today’s timeline, production result, and manual actions together. No separate spreadsheet is needed to explain what happened.
Built for the floor
Juze runs in a normal browser on the plant network, so operators do not need a full computer beside every machine. Give each shared device a station link that opens only its assigned machines.
See it the moment the state changes—not after the next radio call or walkaround.
Give the whole shift one live answer for output, yield, downtime, and active Andons.
Keep the stop reason, operator action, run, and machine timeline together.
Put it on the same board today with operator entry, then automate when it makes sense.
Silence is expensive
Every unnoticed minute starts before someone walks past, checks a whiteboard, or makes a radio call. Juze turns scattered machine and operator information into one shared live picture—without replacing equipment that still works.
The wallboard changes immediately and the active stop appears.
The operator records the reason while the supervisor sees the same event.
Juze keeps the eight-minute loss, the user, and the reason in machine history.
From stopped to solved
When an operator selects a routed stop reason, Juze creates a department request automatically. Maintenance, Tool & Die, Quality, Material, or Production can assign one or more named responders, bring in another department, share updates, and close each team's work with a record of what was actually done.
Select the stop reason once. Routing happens automatically.
The request appears for the assigned response team.
Everyone can see which people and departments are involved.
The repair, timing, notes, and people stay with the event.
Inspected guide pins. Adjusting the left-side alignment block.
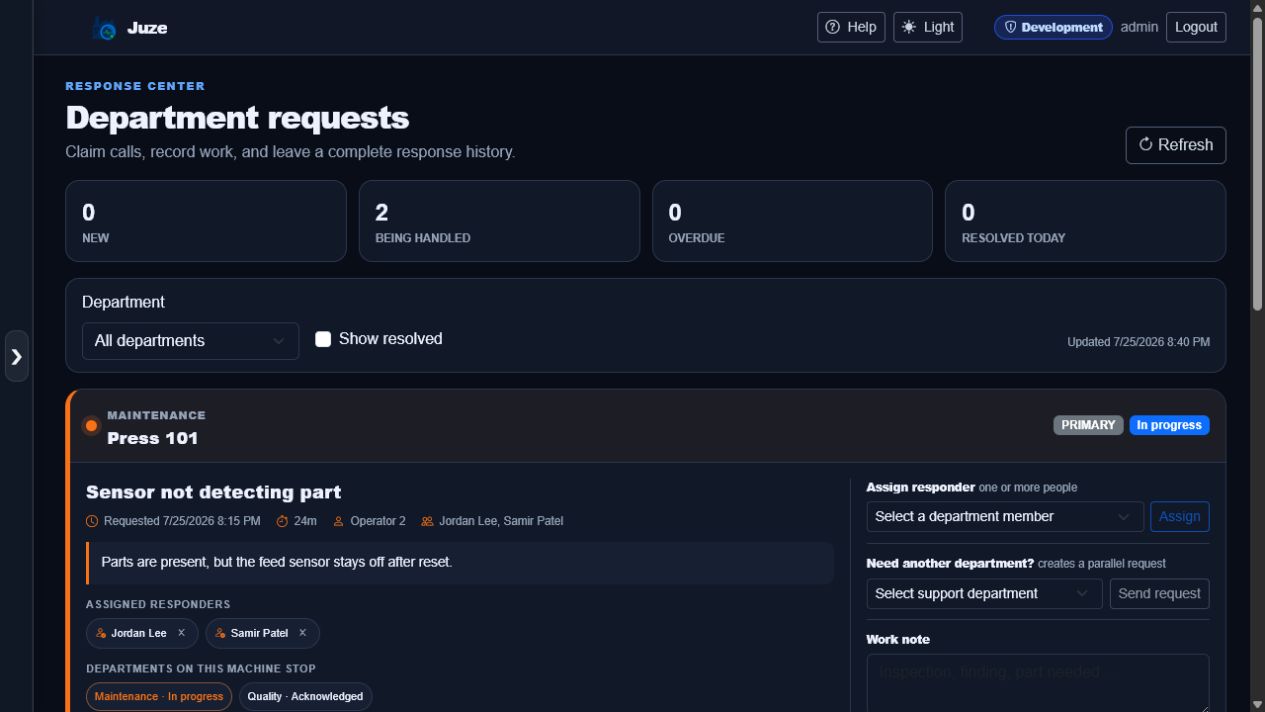
A real Juze work record
This active Maintenance request shows two named responders and a linked Quality request for the same stop. Each department keeps its own status, notes, and resolution while the plant retains one connected event history.
 Open full screen ↗
The request reaches the people who can act without another radio chain.
Operators and leaders see whether the call is new, claimed, or in progress.
Notes keep the next shift informed when work spans people or departments.
Completed work becomes searchable history instead of disappearing after restart.
Start with the plant you have
Juze does not require a perfect automation project before it becomes useful. Give each machine the capture method that makes sense today and keep one consistent operating picture.
Manual operator entry
Operators record runs, stops, parts, counts, scrap, and stop reasons from a tablet or machine-side computer.
Live controller capture
Select a connector per machine, test the connection, and map only the useful signals. Juze monitors values and does not write commands to the controller.
Runtime-only equipment
Warmers, utilities, ovens, and support equipment can start without a recipe while Juze still records running and stopped time.
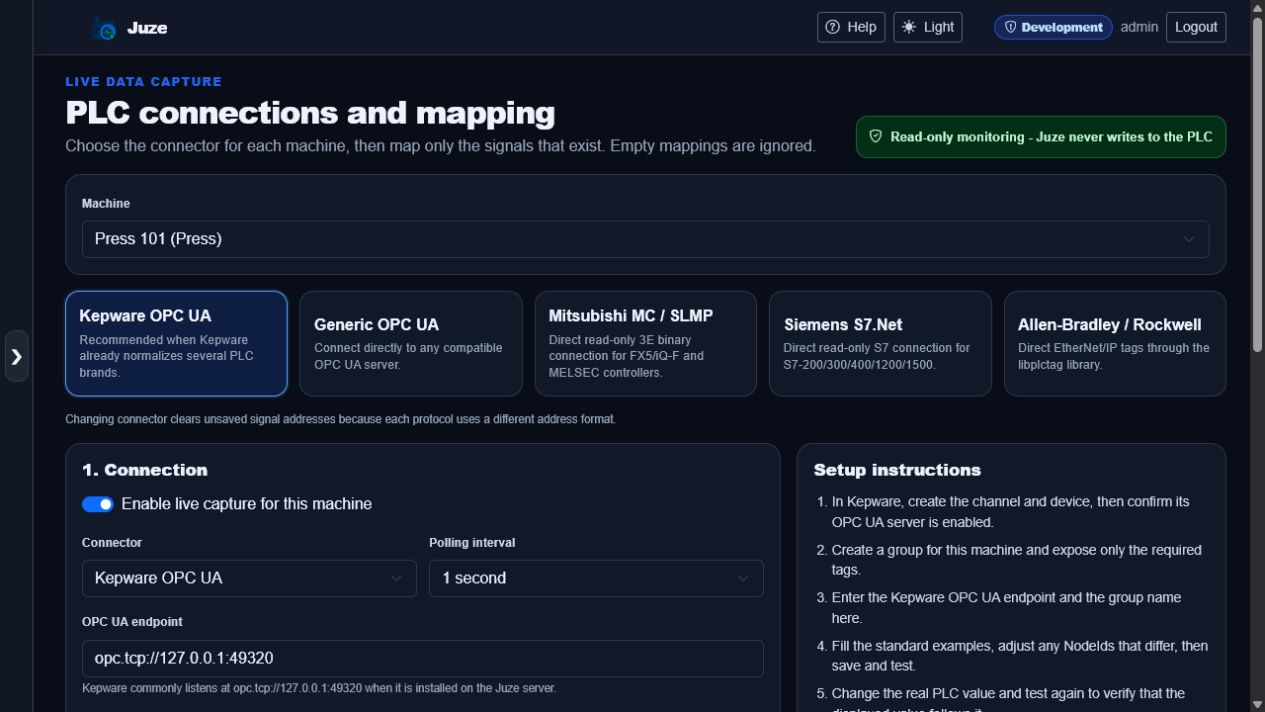
Guided, read-only connectivity
Each machine can use its own driver and its own optional tags. A central Kepware server can also feed many machines while their mappings remain clean and separate.
 Open full screen ↗
No slide deck. Your real floor.
Install it on one Windows computer, add a useful group of machines, and let your real production team decide. The question is simple: did people see problems sooner and understand the shift better?
On-premise. No public PLC access. No forced cloud dependency.
A practical product for plants that want answers, not another complicated system. Questions and demos are welcome in English or Lithuanian.